Fibonacci Retracement Levels: A Complete Guide for Forex Traders
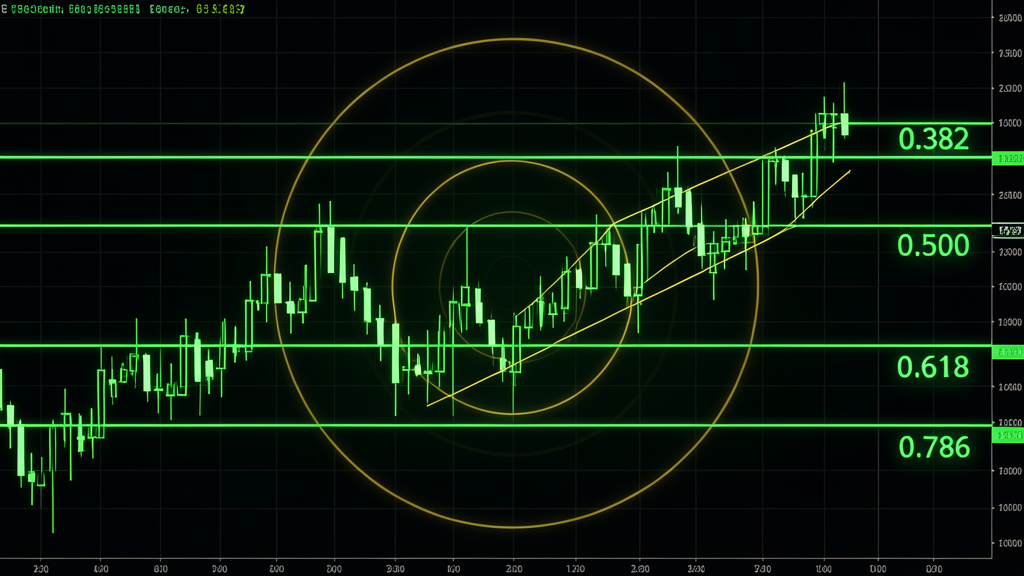
If you have spent any time looking at forex charts you have probably noticed those horizontal lines with labels like 0.618, 0.382, and 0.236. They look mathematical but I promise Fibonacci retracement is one of the most intuitive tools you can add to your trading toolkit.
Today we break down what Fibonacci retracement levels are, why they work, and how to use them to find better entries and exits in forex. By the end you will be spotting Fib levels like a pro.
What Are Fibonacci Retracement Levels?
Fibonacci retracement is a technical analysis tool that uses horizontal lines to indicate potential support and resistance levels based on the Fibonacci sequence. The key levels are 23.6%, 38.2%, 50%, 61.8%, and 78.6%.
The magic number is 0.618 (61.8%) the golden ratio. When a currency pair makes a big move it often retraces to one of these Fibonacci levels before continuing in the original direction.
The Key Fibonacci Levels Explained
- 23.6% (0.236): A shallow retracement signaling a very strong trend.
- 38.2% (0.382): A moderate retracement common in healthy trends.
- 50% (0.500): Not a true Fibonacci number but a psychological halfway point markets respect.
- 61.8% (0.618): The golden ratio and the most important Fibonacci level.
- 78.6% (0.786): A deep retracement. Breaking below signals a possible reversal.
How to Draw Fibonacci Retracement Levels
- Identify a clear trend. Find a clean swing from low to high (uptrend) or high to low (downtrend).
- Select the Fibonacci tool in Travia's charting toolbar.
- Click and drag from the swing low to swing high (or vice versa for downtrends).
- Watch the levels appear automatically on your chart.
Practical Trading Strategies
Strategy 1: Trend Continuation Entry
EUR/USD rallies from 1.0800 to 1.1200. Draw your Fib tool from low to high. Wait for a pullback to the 38.2% or 61.8% level. Look for a bullish candlestick pattern. Place stop loss below the 78.6% level. Target the previous high.
Strategy 2: Fibonacci Confluence
Fibonacci levels are most powerful when they align with other key levels like support/resistance zones, trendlines, or round psychological numbers. This is called confluence.
Strategy 3: Fibonacci Extensions
Use extension levels (127.2% and 161.8%) to set profit targets after price breaks through the original swing high.
Common Mistakes
- Drawing Fibs on weak unclear swings
- Ignoring higher timeframe trends
- Using Fibonacci in isolation without candlestick patterns or other tools
- Being too rigid about exact price levels
Fibonacci in Travia
Travia's charting tools include a Fibonacci tool that snaps to swing points automatically. You can save chart templates with your preferred Fib settings for fast daily analysis.
Final Thoughts
Fibonacci retracement is not a crystal ball but it is a powerful framework for identifying potential reversal zones. Start simple: pick one pair, draw Fib levels on a daily chart, and watch price behavior at the 38.2% and 61.8% levels for two weeks. Happy trading.