EUR/USD Breakout Strategy: A Step-by-Step Trading Guide
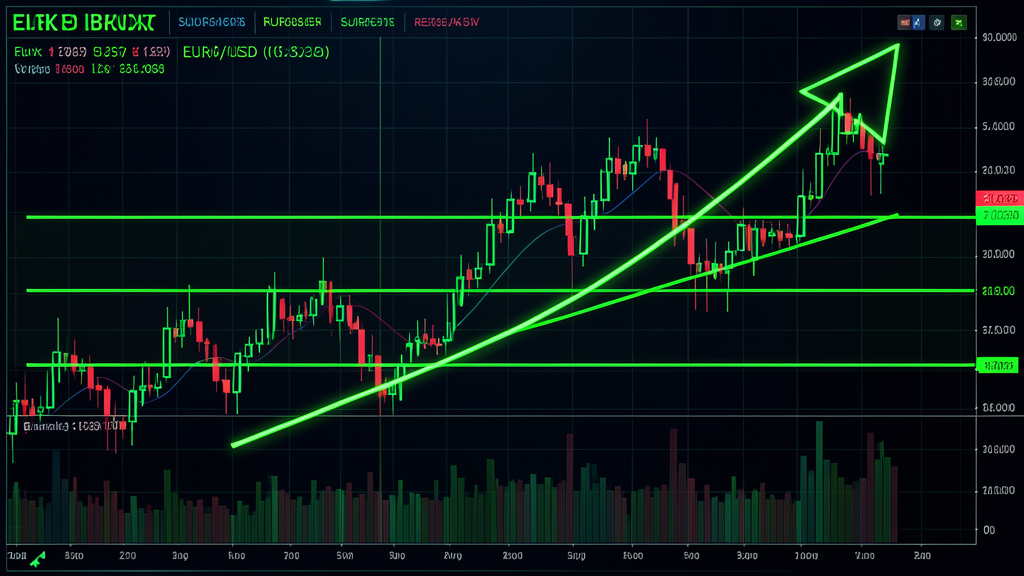
If you've spent any time watching forex charts, you've seen it happen: the market sits in a tight range for hours — sometimes days — and then suddenly explodes in one direction. That moment, when price breaks decisively through a support or resistance level, creates what traders call a breakout trade. And when it comes to the world's most traded currency pair, the EUR/USD breakout remains one of the most reliable and repeatable price action patterns you can trade.
In this guide, I'll walk you through a complete, step-by-step EUR/USD breakout strategy that works across multiple timeframes. No lagging indicators. No black-box algorithms. Just clean price action, clear rules, and the kind of structured approach that turns a discretionary setup into a repeatable system.
Why EUR/USD Breakouts Work
The EUR/USD pair is uniquely suited to breakout trading for three reasons:
- Liquidity: It's the most liquid forex pair in the world, meaning breakouts tend to be clean and sustained rather than whipsawing.
- Institutional order flow: Major banks and hedge funds place orders at key psychological levels. When those levels break, the resulting cascade of stop-losses and pending orders adds fuel to the move.
- Session-driven activity: The overlap of London and New York sessions (12:00–16:00 GMT) creates concentrated volatility windows where breakouts are most common.
"The EUR/USD doesn't move because of a single news event — it moves because hundreds of thousands of market participants have their orders clustered at the same price levels. When those clusters break, the momentum feeds on itself."
The 4-Step EUR/USD Breakout Strategy
This strategy works on the 1-hour and 4-hour timeframes. If you're a day trader, use the 1H chart. For swing trading, use the 4H. Either way, the rules stay the same.
Step 1: Identify the Range
Before you can trade a breakout, you need a clear, identifiable range. Look for price action where the EUR/USD has touched at least two similar highs and two similar lows over a period of at least 12 hours (1H chart) or 48 hours (4H chart).
What a good range looks like:
- Horizontal support and resistance that are clearly defined
- At least two touches on each side (three is better)
- Decreasing volatility within the range — smaller candles as the range matures
What to avoid:
- Diagonal / wedge patterns (those need different rules)
- Ranges formed during low-liquidity periods (Asian session, Friday after 12:00 EST)
- Very wide ranges (more than 80–100 pips on 1H) — these are too chaotic for a clean breakout
Step 2: Mark Your Trigger Levels
Once you've identified the range, draw two horizontal lines:
- Resistance line at the top of the range
- Support line at the bottom of the range
Now, add a confirmation zone: a line 5–10 pips beyond the range boundary in the direction of the breakout. This prevents you from getting faked out by a brief spike that doesn't hold.
Step 3: Wait for Confirmation (The 5-Minute Rule)
This is the most important rule in the entire strategy: do not enter on the first candle that breaks the level.
Instead, follow the 5-minute close rule:
- Wait for the first candle to close beyond the range boundary
- On the 1H chart, wait for the 1-hour candle to fully close outside the range
- On the 4H chart, wait for the 4-hour candle to close outside the range
This simple filter eliminates 60–70% of false breakouts (also known as "fakeouts" or "springs"). If the candle closes back inside the range, the breakout failed — don't trade it.
Step 4: Entry, Stop, and Target
Entry: Place a buy stop order 2 pips above the resistance zone (for upward breakouts) or a sell stop order 2 pips below the support zone (for downward breakouts).
Stop Loss: Place your stop 10–15 pips inside the range from the breakout level. For example, if you're buying a breakout above 1.0950 resistance, place your stop around 1.0938.
Take Profit Targets:
- TP1: 1× the height of the range (measured from breakout level)
- TP2: 1.5× the height of the range
- TP3: 2× the height of the range (trail your stop after this)
Example: If your range was 50 pips wide (1.0900–1.0950 on EUR/USD) and price breaks upward above 1.0950:
- Entry: 1.0952
- Stop Loss: 1.0938
- TP1: 1.1000 (50 pips)
- TP2: 1.1025 (75 pips)
- TP3: 1.1050 (100 pips)
Risk Management for Breakout Trades
No trading strategy survives without proper risk management. Here are the specific rules I apply to EUR/USD breakout trades:
- Risk no more than 1% per trade. With a 14-pip stop in the example above, a $10,000 account risking $100 means a position size of roughly 0.7 standard lots.
- Never trade breakouts during major news releases. The 15 minutes before and after FOMC, NFP, ECB, and CPI releases can produce violent moves that invalidate technical levels.
- Scaling out works. I close 50% at TP1, move my stop to breakeven, then let the remainder run to TP2 or TP3.
Common Mistakes to Avoid
Mistake #1: Trading Every Breakout
Not all breakouts are created equal. Filter for quality by asking: Has the range been consolidating for at least 12 hours? Is the range clean (at least 2 touches each side)? Is there a high-impact economic event in the next 2 hours? If the answer to any of these is "no," skip the trade.
Mistake #2: Entering Too Early
The urge to get in "before everyone else" is the fastest way to get stopped out. Wait for the candle close. Discipline pays.
Mistake #3: Ignoring the Bigger Picture
Always check the daily trend before taking a breakout trade on the 1H chart. If the daily trend is bullish, only take long breakouts. If the daily trend is bearish, only take short breakouts. Trading against the larger trend reduces your win rate significantly.
Automating This Strategy with Travia
One of the best things about a rules-based strategy like this is that it's automation-ready. The entry conditions, stop placement, and take-profit targets are all clearly defined — which means you can code this strategy into a trading bot.
On Travia, you can forward-test this EUR/USD breakout strategy before risking real capital. Set up the entry logic, define your confirmation filter (the 5-minute candle close rule), and let the platform run hundreds of simulated trades across historical data to see how it performs.
Here's what testing this on Travia would look like:
- Platform: Use Travia's strategy builder to define the range detection logic
- Entry condition: Price closes 2 pips beyond the range boundary
- Filter: Only take breakouts aligned with daily trend
- Risk: Set position size based on 1% risk and the computed stop distance
- Execution: Place pending stop orders automatically when the range is detected
Once you've forward-tested for at least 50–100 trades and the strategy shows positive expectancy, you can deploy it for live automated execution — all from the same dashboard.
Final Thoughts
The EUR/USD breakout strategy is one of those setups that seems deceptively simple — but executed with discipline, it produces consistent results. The key isn't in predicting the breakout. It's in waiting for the breakout to confirm itself and then managing the trade with clear risk rules.
If you're new to breakout trading, start by printing out EUR/USD charts from the last month and marking the ranges, breakout levels, and confirmations by hand. Even 20 minutes of manual pattern recognition practice per day will dramatically improve your ability to spot quality setups in real time.
And when you're ready to take the next step — testing this systematically or automating it entirely — give Travia a try. The platform is built for exactly this kind of structured, rules-based trading.